A dashboard just for me
Building a private developer dashboard inside RedCheck: a feedback inbox, what the AI costs, two honest definitions of an active user, and a one-glance answer to "which build is running?"
Since September, RedCheck has had a small form in Settings to report a
bug or suggest something. It worked. The only way to read what people
sent was to open a MySQL console on the production server and run a
SELECT.
That’s fine once. It’s not fine as the way you listen to your users. So I started sketching a dashboard inside RedCheck, visible only to me. Then I stopped and asked whether it was worth building at all.
What not to build
A “developer dashboard” invites scope creep. Latency charts, error rates, CPU, memory, a list of every user. I cut most of it before writing any code.
- No performance monitoring. Tools like Sentry, Grafana or Uptime Kuma do it better, and they keep working when the app is down. A dashboard that lives inside the backend can’t tell you the backend has crashed.
- No browsing individual users’ data. Even if only I can see it, the page shows aggregates. The one exception is feedback, where I need the author’s email to answer them.
- What stays is what only my database knows: the feedback, how often the AI is used (which is what costs money), and whether people come back.
I split it into three phases: the feedback inbox and AI usage first, then active users, then a small system section. All of it lived on a feature branch, got tested locally, and only then became a pull request.
Only me, enforced by the backend
There’s exactly one admin, so a roles table would have been ceremony.
Access is an allowlist in an environment variable, ADMIN_EMAILS, and
Spring Security restricts everything under /admin/** to it. The
profile endpoint also returns an isAdmin flag so the frontend knows
whether to show the entry point in Settings. That flag is cosmetic:
anyone who types /developer by hand gets a 403 from the API and a
“No access” screen.
The test for that rule caught something before it shipped. A regular
user got 200 instead of 403. The rule was fine; the test wasn’t.
RedCheck’s User entity uses Lombok’s
@EqualsAndHashCode(onlyExplicitlyIncluded = true) with no fields
included, so every user is equal to every other user. A mock set up
to answer “yes” for the admin answered “yes” for everybody. The stub now
matches by email, and that quirk is documented where the next person
will look.
A feedback inbox
Most of the feedback table’s problem was that it had no state. You couldn’t tell what you had already read. Each entry now has a status (new, seen, in progress, done, won’t fix) and a private note. Opening a new entry marks it as seen automatically, so the “new” count means something without a separate “mark as read” step.
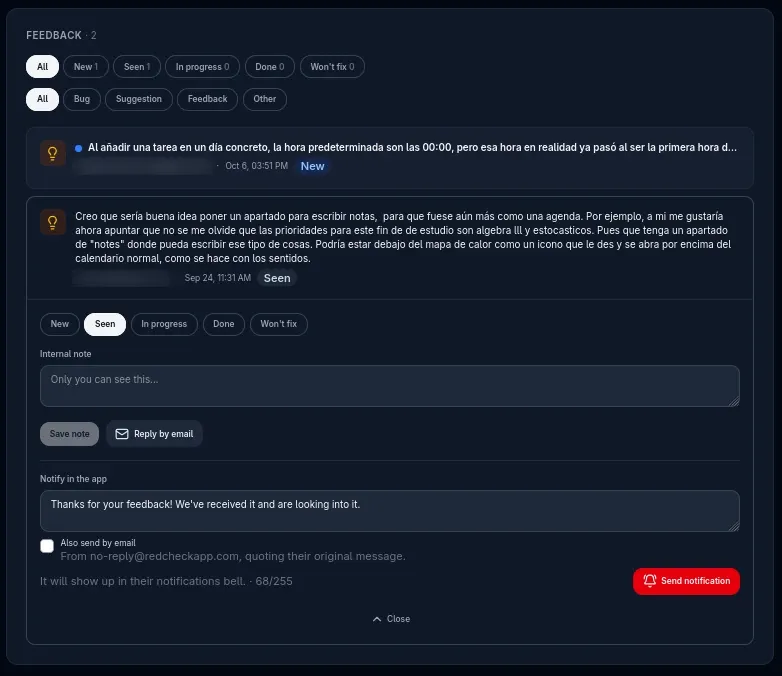
Once a note is saved and the entry is closed, it stays visible under the author’s line, so I don’t have to reopen anything to remember why.

I also get an email for every new submission. That reused the Resend setup from the password-reset work (part 13), and the user’s message is HTML-escaped before it goes into the email, because it’s user input.
![A Gmail message titled “[RedCheck] PRAISE: Test feedback!” with the category, “Nuevo feedback en RedCheck”, the sender’s email, the message in a grey box and an “Abrir panel de desarrollador” button.](/_astro/email-new-feedback.CfOJ1dhI_wG8DJ.webp)
Answering was the interesting decision. There were three options:
- A
mailto:link. No backend at all, and the conversation continues in my inbox. But nothing is recorded in the app. - A notification inside RedCheck. Cheap, and the person sees that their suggestion led somewhere. But only if they open the app again.
- An email from the app’s no-reply address. It reaches people who never come back. But it’s one-way: a reply goes nowhere.
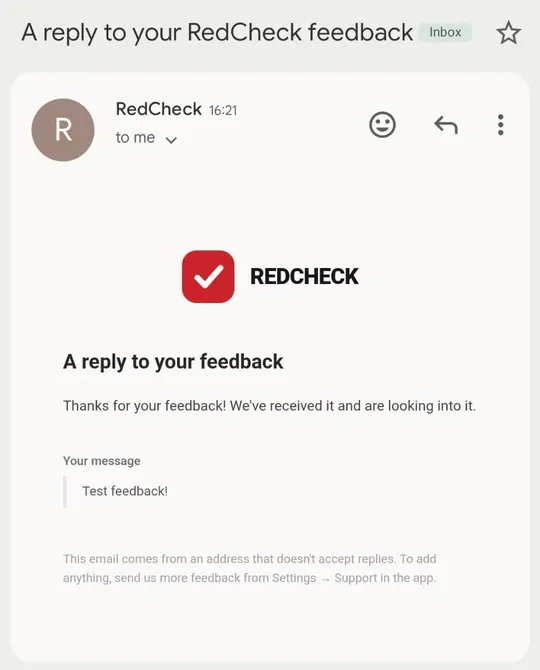
I shipped all three, layered: the mailto: link for conversations, the
in-app notification as the default reply, and a checkbox to also send it
by email. The email quotes their original message and says plainly that
the address doesn’t accept replies.
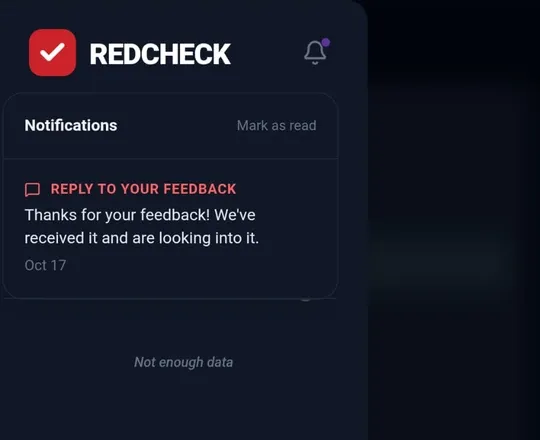
The in-app part held a surprise. RedCheck’s backend had been creating notifications for months, and the frontend had never shown a single one. The bell only displayed a local “your AI plan is ready” flag. Listing everything would have dumped months of unread, English-only AI notifications on every user at once. So notifications now have a type, and the bell shows only replies to your feedback.
What the AI costs
The obvious way to count AI usage was the table where analyses are stored. It would have been wrong twice. Running a new analysis deletes the previous one from the same day, and failed calls are never stored. So every call to the AI engine now writes one row to its own log: the type of call, whether it succeeded, and how long it took. That write runs in its own transaction and catches its own errors. Losing a log row is fine. Breaking someone’s analysis because a log write failed is not.
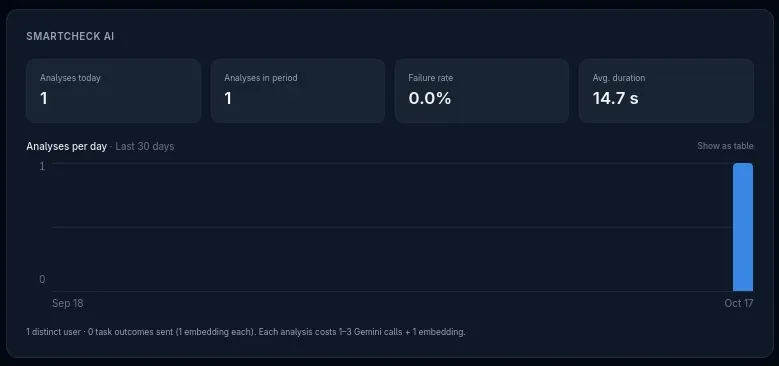
The honest limit: this counts calls, not tokens. The engine retries Gemini up to three times internally and doesn’t return token usage yet, so one analysis costs between one and three model calls plus an embedding. Real token counts need a change in the engine itself, and the dashboard says so instead of showing a number that looks precise and isn’t.
Two definitions of an active user
“How many active users do I have?” sounds like one number. I ended up showing two, because each one is honest about something different.
- Active: had an authenticated request in the period. RedCheck now
stores a
lastSeenAtper user. To avoid a database write on every request, it’s refreshed at most once an hour, and the check is in memory against the user the JWT filter has already loaded. It’s exact, but it only starts counting from the day it was deployed. - Using the app: completed a task or created one by hand in the period. It’s computed from data RedCheck already had, so it has full history from day one. Tasks generated by recurring routines don’t count as “created”, since the user didn’t create them, but completing one does.
Both leave out the public demo accounts, which anyone trying RedCheck shares, and my own account. Either would inflate every number.
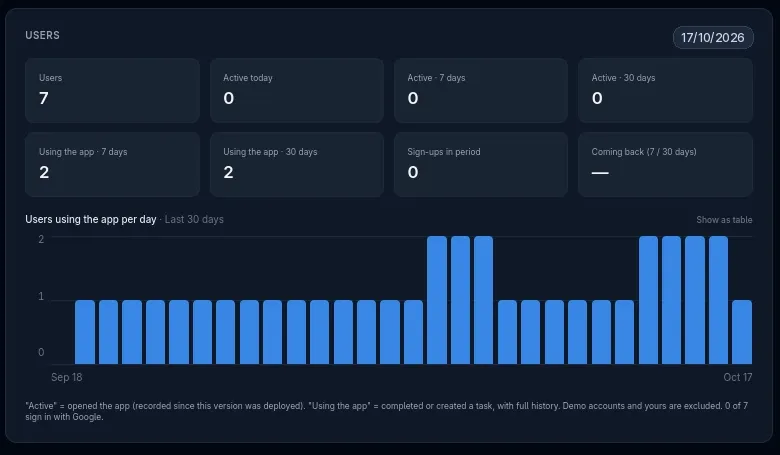
The difference between the two is useful in itself. Someone who opens the app every day and never completes anything is telling me something too.
Which build is running?
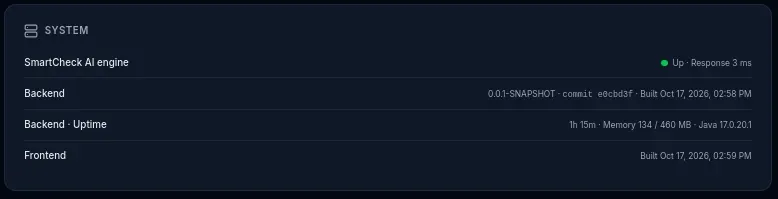
The last section is the smallest, and the one I’ll probably open most. It shows the commit and build time of the running backend, the frontend’s build time, uptime, memory, and whether the AI engine answers its health check.
When something that should work doesn’t, the first question is always the same: is the code I’m looking at the code that’s running? In part 13, new email settings never reached production because one repository had no deploy pipeline, and it took a session on the server to find out. Now the answer is on a page. CI passes the commit into the Docker image when it builds it, and the backend reports it. A local build says “local build” instead of pretending to know.
What I took away
- Before building a dashboard, decide what it’s not for. Monitoring that dies with your app isn’t monitoring.
- Count from an event log, not from tables that keep only the latest state.
- “Active user” is a definition, not a fact. Show which one you mean.
- “Which commit is running?” should take one glance, not an SSH session.
- The reply you can send in one click is the one you’ll actually send.
If you’ve sent feedback from RedCheck’s Settings, it’s no longer sitting in a table. I’m reading it.
Desde septiembre, RedCheck tiene un pequeño formulario en Ajustes para
reportar un bug o sugerir algo. Funcionaba. La única forma de leer lo que
enviaba la gente era abrir una consola de MySQL en el servidor de
producción y lanzar un SELECT.
Eso vale una vez. No vale como forma de escuchar a tus usuarios. Así que empecé a esbozar un panel dentro de RedCheck, visible solo para mí. Luego paré y me pregunté si merecía la pena construirlo.
Lo que no construir
Un “panel de desarrollador” invita a inflar el alcance: gráficas de latencia, tasas de error, CPU, memoria, una lista con todos los usuarios. Recorté casi todo antes de escribir una línea.
- Nada de monitorizar rendimiento. Herramientas como Sentry, Grafana o Uptime Kuma lo hacen mejor, y siguen funcionando cuando la app se cae. Un panel que vive dentro del backend no puede avisarte de que el backend se ha caído.
- Nada de curiosear los datos de cada usuario. Aunque solo lo vea yo, el panel muestra agregados. La única excepción es el feedback, donde necesito el email del autor para poder responderle.
- Lo que queda es lo que solo sabe mi base de datos: el feedback, cuánto se usa la IA (que es lo que cuesta dinero) y si la gente vuelve.
Lo dividí en tres fases: primero la bandeja de feedback y el uso de la IA, después los usuarios activos y por último una pequeña sección de sistema. Todo vivió en una rama, se probó en local y solo entonces se convirtió en una pull request.
Solo yo, y lo impone el backend
Hay exactamente un administrador, así que una tabla de roles habría sido
pura ceremonia. El acceso es una lista de emails permitidos en una
variable de entorno, ADMIN_EMAILS, y Spring Security restringe todo lo
que cuelga de /admin/** a esa lista. El endpoint del perfil devuelve
además un isAdmin para que el frontend sepa si mostrar la entrada en
Ajustes. Ese indicador es solo estético: quien escriba /developer a
mano recibe un 403 de la API y una pantalla de “Sin acceso”.
El test de esa regla cazó algo antes de salir a producción. Un usuario
normal recibía 200 en lugar de 403. La regla estaba bien; el test no.
La entidad User de RedCheck usa
@EqualsAndHashCode(onlyExplicitlyIncluded = true) de Lombok sin ningún
campo incluido, así que todos los usuarios son iguales entre sí. Un
mock preparado para decir “sí” al administrador le decía “sí” a todo el
mundo. Ahora el stub compara por email, y esa rareza está documentada
donde la va a buscar el siguiente que toque el código.
Una bandeja de feedback
Casi todo el problema de la tabla de feedback era que no tenía estado. No había forma de saber qué habías leído ya. Cada entrada tiene ahora un estado (nuevo, visto, en curso, hecho, descartado) y una nota privada. Al abrir una entrada nueva se marca sola como vista, así que el contador de nuevos significa algo sin un paso aparte de “marcar como leído”.
Cuando guardas una nota y cierras la entrada, la nota sigue visible debajo de la línea del autor, así que no hace falta volver a abrir nada para recordar por qué.
También me llega un email por cada envío nuevo. Reutiliza la configuración de Resend de la recuperación de contraseña (parte 13), y el mensaje del usuario se escapa como HTML antes de meterlo en el correo, porque es texto que escribe el usuario.
La decisión interesante fue cómo responder. Había tres opciones:
- Un enlace
mailto:. Sin nada de backend, y la conversación sigue en mi bandeja. Pero no queda nada registrado en la app. - Una notificación dentro de RedCheck. Barata, y la persona ve que su sugerencia sirvió para algo. Pero solo si vuelve a abrir la app.
- Un email desde la dirección no-reply de la app. Llega a quien no vuelve. Pero es de un solo sentido: una respuesta no llega a ninguna parte.
Puse las tres, por capas: el mailto: para conversar, la notificación
dentro de la app como respuesta por defecto y una casilla para enviarla
también por email. El email cita su mensaje original y dice claramente
que esa dirección no admite respuestas.
La parte de la app escondía una sorpresa. El backend de RedCheck llevaba meses creando notificaciones, y el frontend no había mostrado ni una. La campana solo enseñaba un aviso local de “tu plan de IA está listo”. Listarlas todas habría soltado de golpe a cada usuario meses de avisos de IA sin leer y solo en inglés. Así que las notificaciones tienen ahora un tipo, y la campana solo muestra las respuestas a tu feedback.
Lo que cuesta la IA
La forma obvia de contar el uso de la IA era la tabla donde se guardan los análisis. Habría fallado por partida doble: lanzar un análisis nuevo borra el anterior del mismo día, y las llamadas fallidas no se guardan nunca. Así que cada llamada al motor de IA escribe ahora una fila en su propio registro: el tipo de llamada, si salió bien y cuánto tardó. Esa escritura va en su propia transacción y captura sus propios errores. Perder una fila del registro no pasa nada. Romperle el análisis a alguien porque falló el registro, sí.
El límite honesto: esto cuenta llamadas, no tokens. El motor reintenta con Gemini hasta tres veces por dentro y todavía no devuelve el consumo de tokens, así que un análisis cuesta entre una y tres llamadas al modelo más un embedding. Para tener tokens reales hay que cambiar el propio motor, y el panel lo dice en lugar de enseñar un número que parece preciso y no lo es.
Dos definiciones de usuario activo
“¿Cuántos usuarios activos tengo?” suena a un solo número. Acabé mostrando dos, porque cada uno es honesto con algo distinto.
- Activos: han hecho alguna petición con sesión iniciada en el
periodo. RedCheck guarda ahora un
lastSeenAtpor usuario. Para no escribir en la base de datos en cada petición, se actualiza como mucho una vez por hora, y la comprobación se hace en memoria con el usuario que el filtro JWT ya ha cargado. Es exacto, pero solo empieza a contar desde el día en que se desplegó. - Usan la app: han completado una tarea o han creado una a mano en el periodo. Se calcula con datos que RedCheck ya tenía, así que tiene histórico completo desde el primer día. Las tareas que generan las rutinas no cuentan como “creadas”, porque no las creó el usuario, pero completarlas sí cuenta.
Las dos dejan fuera las cuentas demo públicas, que comparte cualquiera que prueba RedCheck, y mi propia cuenta. Cualquiera de ellas inflaría todas las cifras.
La diferencia entre las dos ya es útil en sí misma. Alguien que abre la app todos los días y nunca completa nada también me está diciendo algo.
¿Qué versión está corriendo?
La última sección es la más pequeña, y probablemente la que más voy a abrir. Muestra el commit y la fecha de compilación del backend que está corriendo, la fecha de compilación del frontend, el tiempo en marcha, la memoria y si el motor de IA responde a su comprobación de salud.
Cuando algo que debería funcionar no funciona, la primera pregunta es siempre la misma: ¿el código que estoy mirando es el que está corriendo? En la parte 13, la nueva configuración del correo nunca llegó a producción porque un repositorio no tenía pipeline de despliegue, y hizo falta una sesión en el servidor para descubrirlo. Ahora la respuesta está en una página. El pipeline de CI le pasa el commit a la imagen de Docker al construirla, y el backend lo muestra. Una build local dice “build local” en lugar de fingir que lo sabe.
Con qué me quedo
- Antes de construir un panel, decide para qué no es. Una monitorización que se cae con tu app no es monitorización.
- Cuenta a partir de un registro de eventos, no de tablas que solo guardan el último estado.
- “Usuario activo” es una definición, no un hecho. Muestra cuál usas.
- “¿Qué commit está corriendo?” debería responderse de un vistazo, no con una sesión SSH.
- La respuesta que puedes enviar con un clic es la que de verdad vas a enviar.
Si has enviado feedback desde los Ajustes de RedCheck, ya no se queda en una tabla. Lo estoy leyendo.
- Backend
- Frontend
- DevOps