Before the first commit
RedCheck started as a paper notebook and a planning habit no app could reproduce. How a daily ritual became sketches, and the sketches became a data model.
RedCheck went live in June 2026, and this series started there. But the project is older than its first commit, and a lot of what it is today was decided before I wrote a single line of code. This part, and the four after it, go back to the beginning.
A notebook and a habit
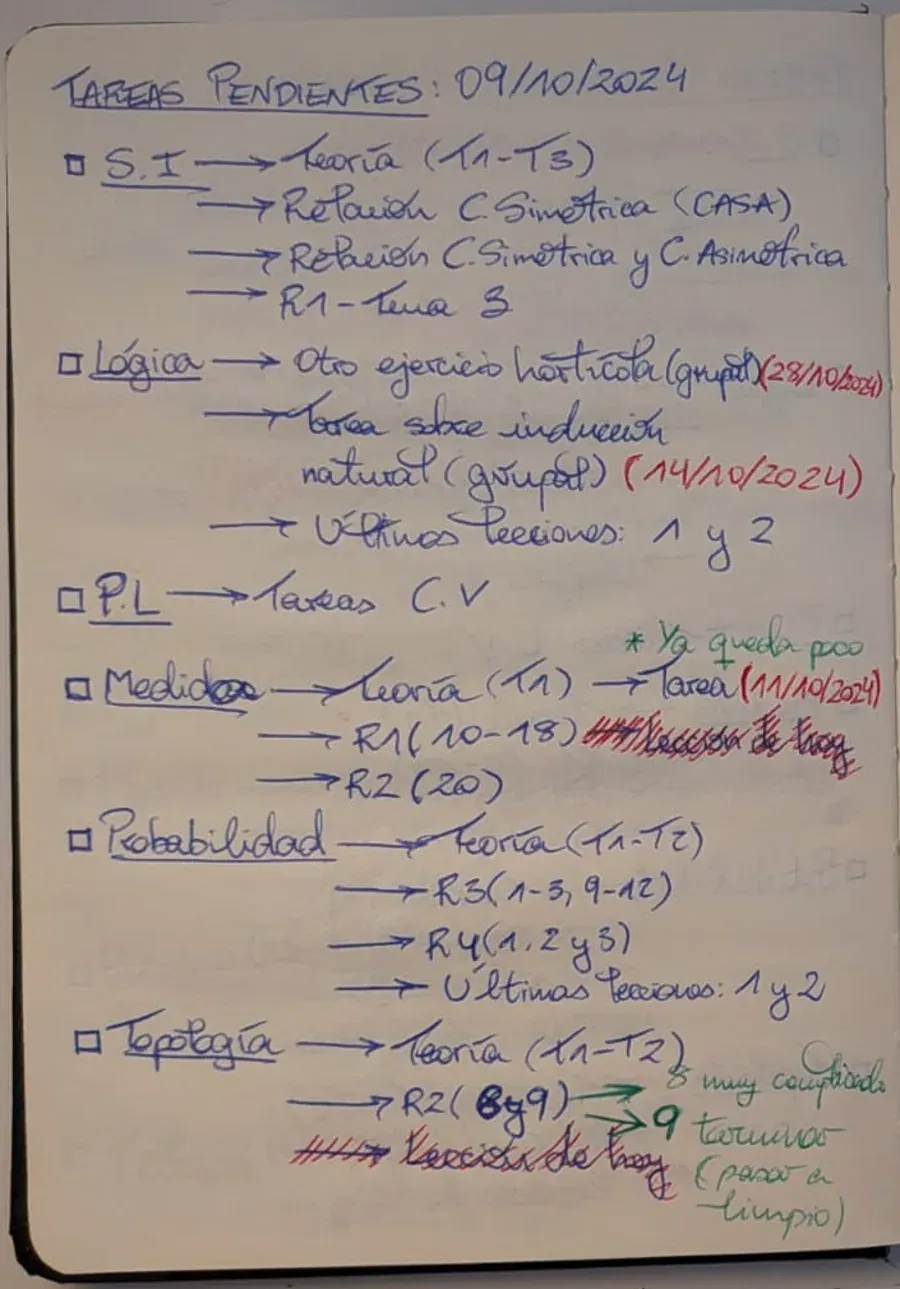
For most of my degree I planned every day the same way, by hand, in a notebook. At the top of the page went the date and the day of the week: Tareas pendientes: 17/03/2025, L. Below it, one block per subject: the subject’s name, underlined, with a checkbox next to it, and an arrow to each thing I had to do for it. Deadlines went in red, in brackets. When I finished something, I crossed it out with red hatching. When every task of a subject was done, I ticked the subject’s box.
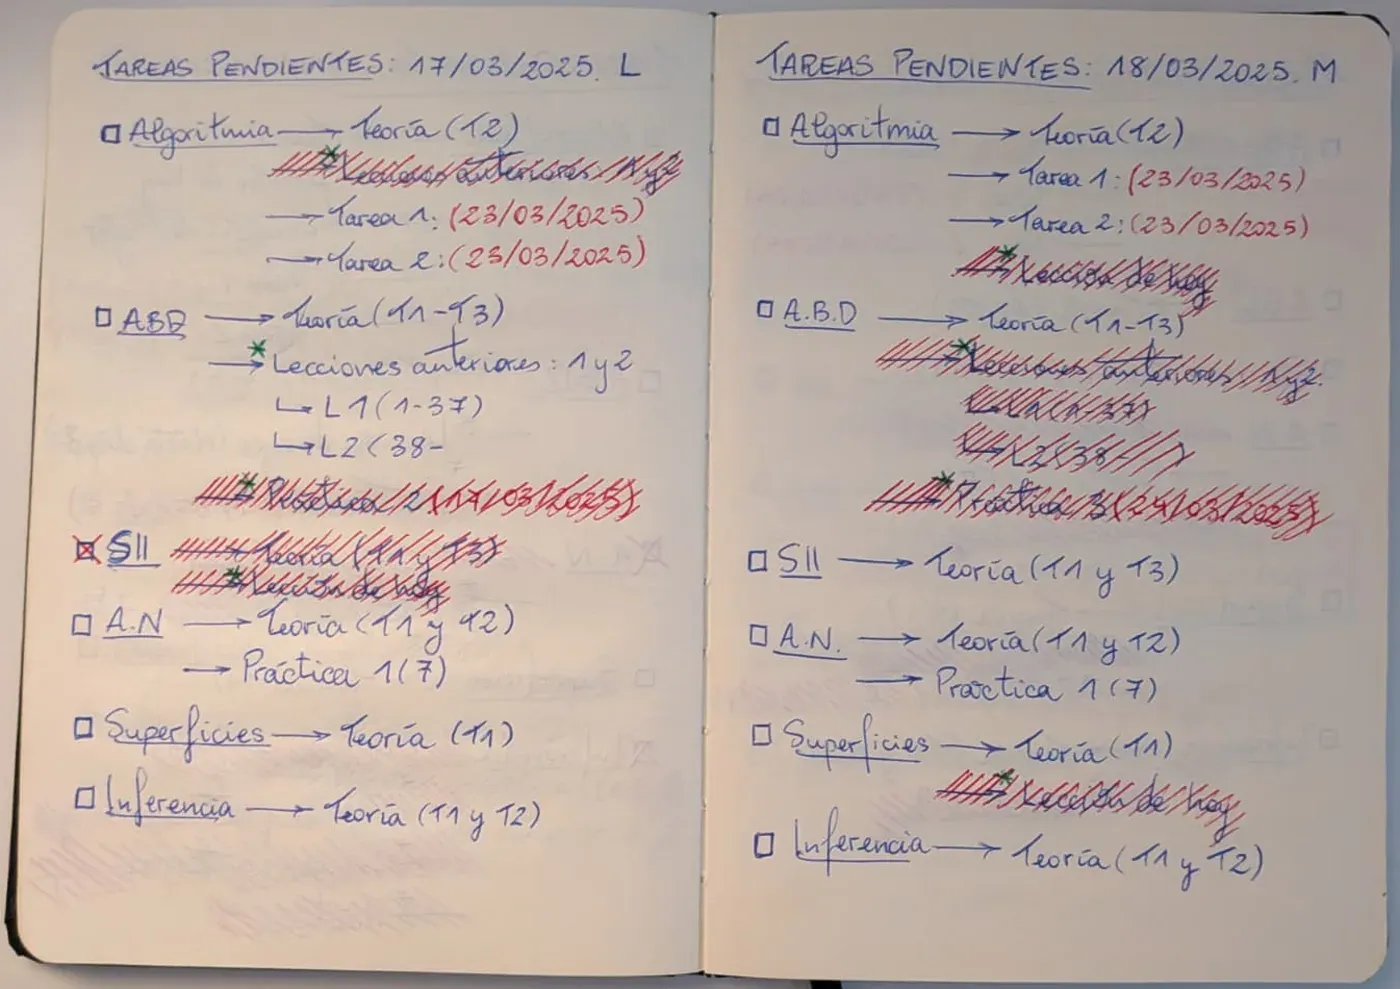
It worked. It was fast to write, fast to read, and it showed me at a glance which subjects were under control and which weren’t. It also had an obvious cost, visible in the photo above: every morning I copied whatever hadn’t been done the day before onto a new page. The plan was the easy part; the copying was the chore.
Why not just use an app?
I tried. The problem was never a lack of apps, it was that none of them matched this way of working:
- Todoist is fast and minimal, but its sidebar is full of options I didn’t need, and the statistics I cared about are behind the paid plan.
- Notion can model anything, which is exactly the problem. Building my system in it would have meant designing a database before planning my day.
- Google Calendar thinks in events with a start and an end. Most of my tasks were “before Friday”, not “Tuesday from 4 to 6”.
- Microsoft To Do is simple, but it’s a list. It doesn’t group by subject and has no sense of progress over time.
What I wanted was narrower than any of them: open it, see today grouped by subject, add a task in a few seconds, tick it off. Plus two things a notebook can’t do: carry pending tasks over to the next day by itself, and show me how consistent I’d been over weeks, not just today.
From the notebook to a sketch
In July 2025 I drew what that app would look like. The main area is the notebook page, almost literally: the date at the top, subjects with a checkbox, arrows to tasks, deadlines in red, finished tasks crossed out.
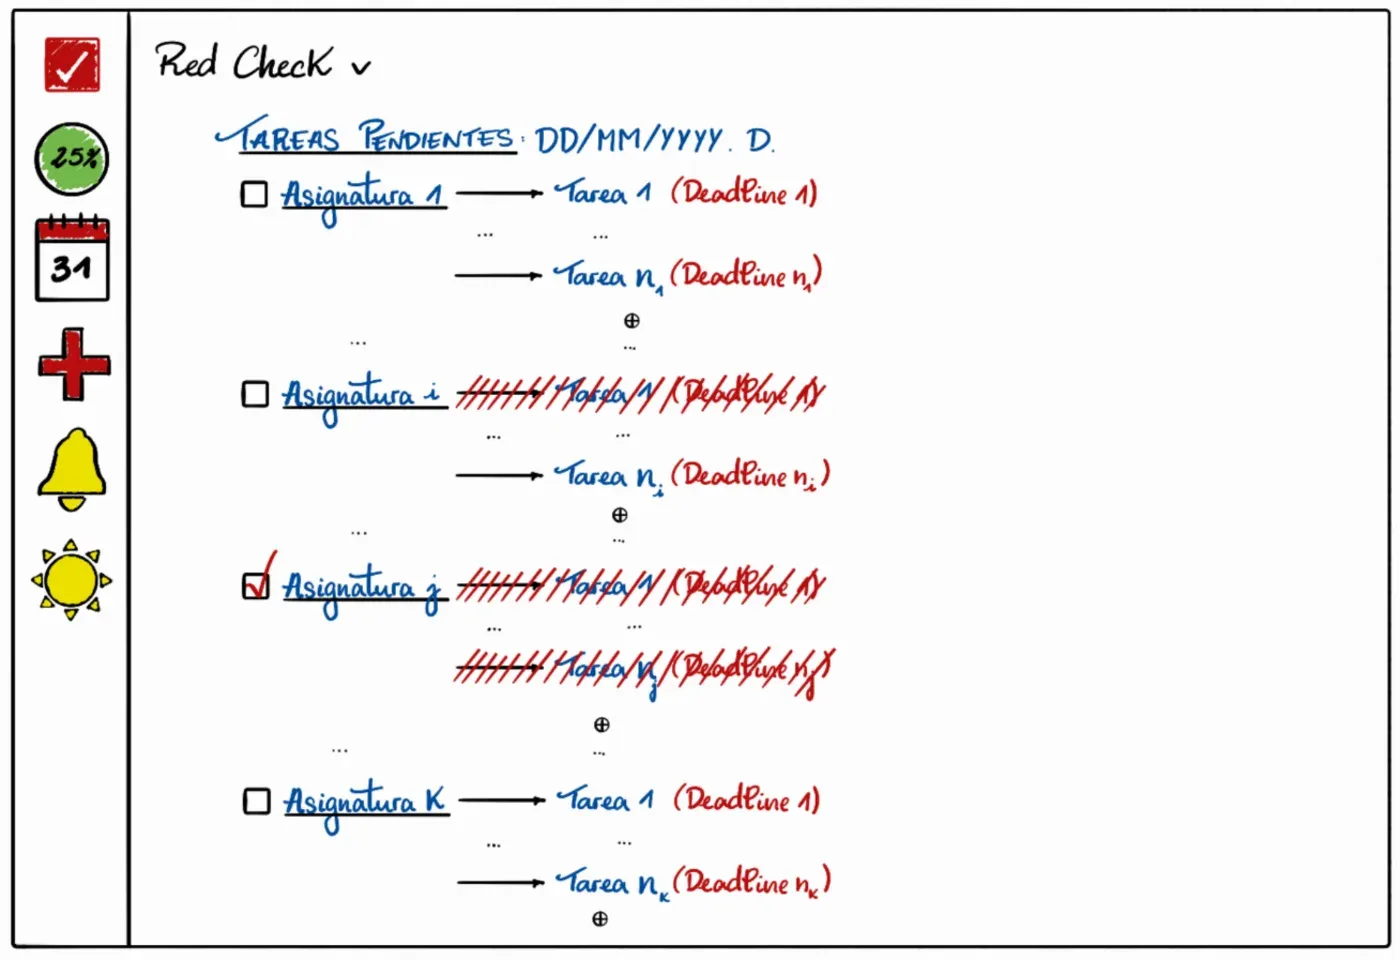
Everything the notebook couldn’t do went into a sidebar that folds out: progress for the day, overall and per subject, and a month calendar.
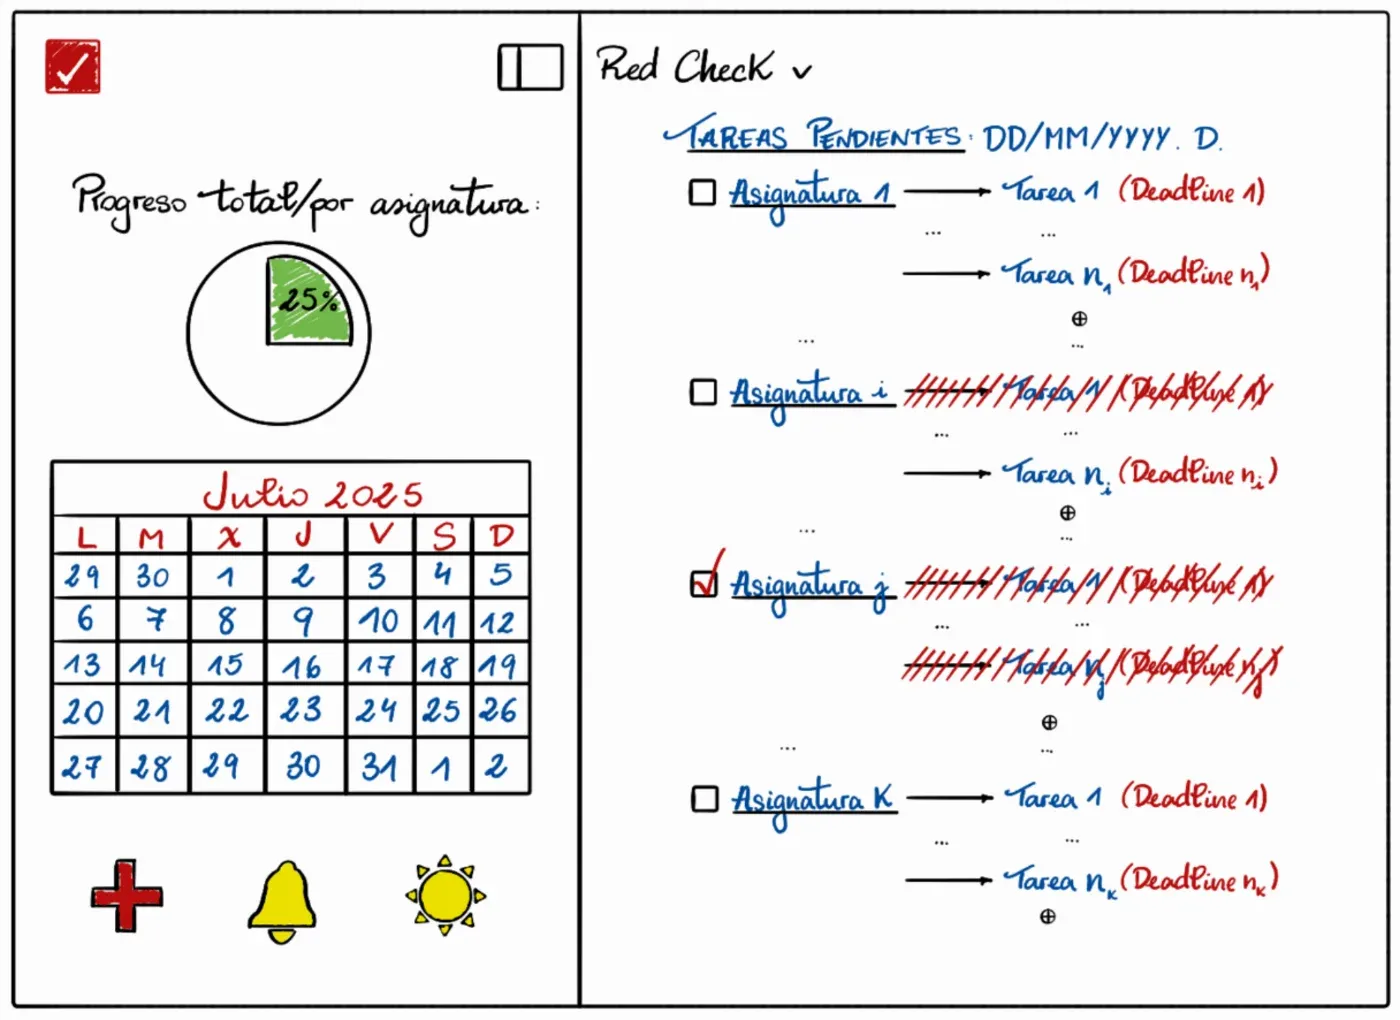
Some of those ideas survived almost untouched. The grouping by subject, the red deadlines and the progress circle are all still in RedCheck today. Others took a long time: the sun in the corner is a theme switch, and dark mode only arrived fourteen months later, in part 9.
From the sketch to a data model
Before writing code I wanted the data model right, because that’s the part that is expensive to change later. Two decisions from that stage shaped everything that came after.
A subject is an entity, not a label. My first instinct was the
notebook’s: a task has a subject, so give each task a subject text
field and group by it on screen. The interface would have looked exactly
the same. The model underneath wouldn’t have backed it up: “Maths” and
“maths” would be two subjects, there would be nowhere to store a
subject’s description or whether it’s archived, and renaming one would
mean updating every task. So SUBJECT became its own table, and every
task points to one.
A recurring task is not a task. The tempting design was a single
TASK table with an is_recurring flag and a frequency column. But the
two have different lifecycles. A task is created by the user, has an
optional deadline and ends when it’s completed. A recurring task is a
template: it has no deadline, it’s never “completed”, only switched on
or off, and the actual tasks are generated from it by the system. One
table for both would have meant half the columns being null depending
on the row, and every query having to remember which kind it was
looking at. So they’re two tables, linked by an optional foreign key.
A third decision came from thinking about the calendar. I wanted each
day coloured by how much of it I’d completed, like GitHub’s contribution
graph. Computing that on the fly means aggregating every task for every
visible day, every time the calendar loads. Instead, a
PROGRESS_RECORD row stores each user’s completion for each day, and
the calendar just reads it.
What I took from this stage
- The best product spec I had was a habit I’d repeated for years. The sketch was mostly a translation of it.
- Drawing the interface first told me what the data model had to support. The model then caught things the drawing hid, like a subject needing to exist on its own.
- Every app I tried was good. None was mine. That gap is a perfectly good reason to build something.
On 2 March 2026 I made the first commit. The next part is about the backend that came out of it, and about building it before a single screen existed.
RedCheck salió a producción en junio de 2026, y esta serie empezaba ahí. Pero el proyecto es más antiguo que su primer commit, y buena parte de lo que es hoy se decidió antes de escribir una sola línea de código. Esta parte, y las cuatro siguientes, vuelven al principio.
Una libreta y una costumbre
Durante casi toda la carrera planifiqué cada día igual, a mano, en una libreta. Arriba de la página, la fecha y la inicial del día: Tareas pendientes: 17/03/2025, L. Debajo, un bloque por asignatura: el nombre subrayado, con una casilla al lado, y una flecha hacia cada cosa que tenía que hacer. Las fechas límite, en rojo y entre paréntesis. Cuando terminaba algo, lo tachaba con un rayado rojo. Cuando terminaba todas las tareas de una asignatura, marcaba su casilla.
Funcionaba. Era rápido de escribir, rápido de leer, y me enseñaba de un vistazo qué asignaturas tenía controladas y cuáles no. También tenía un coste evidente, que se ve en la foto de arriba: cada mañana copiaba en una página nueva todo lo que no había terminado el día anterior. Planificar era lo fácil; copiar era la carga.
¿Por qué no usar una app?
Lo intenté. El problema nunca fue que faltaran apps, sino que ninguna encajaba con esta forma de trabajar:
- Todoist es rápida y minimalista, pero su barra lateral está llena de opciones que no necesitaba, y las estadísticas que me interesaban son de pago.
- Notion puede modelar cualquier cosa, y ese es justo el problema. Montar mi sistema ahí habría significado diseñar una base de datos antes de planificar mi día.
- Google Calendar piensa en eventos con inicio y fin. La mayoría de mis tareas eran “antes del viernes”, no “el martes de 4 a 6”.
- Microsoft To Do es sencilla, pero es una lista. No agrupa por asignatura ni tiene ninguna idea de progreso en el tiempo.
Lo que yo quería era más concreto que cualquiera de ellas: abrirla, ver el día agrupado por asignaturas, añadir una tarea en unos segundos, marcarla. Y dos cosas que una libreta no puede hacer: pasar sola las tareas pendientes al día siguiente, y enseñarme lo constante que había sido durante semanas, no solo hoy.
De la libreta al boceto
En julio de 2025 dibujé cómo sería esa app. La zona principal es la página de la libreta, casi literalmente: la fecha arriba, asignaturas con casilla, flechas hacia las tareas, fechas límite en rojo, tareas terminadas tachadas.
Todo lo que la libreta no podía hacer fue a una barra lateral que se despliega: el progreso del día, total y por asignatura, y un calendario mensual.
Algunas de esas ideas sobrevivieron casi intactas. La agrupación por asignaturas, las fechas límite en rojo y el círculo de progreso siguen en RedCheck hoy. Otras tardaron bastante: el sol de la esquina es un selector de tema, y el modo oscuro no llegó hasta catorce meses después, en la parte 9.
Del boceto al modelo de datos
Antes de escribir código quería tener bien el modelo de datos, porque es lo que sale caro cambiar después. Dos decisiones de esa etapa marcaron todo lo que vino luego.
Una asignatura es una entidad, no una etiqueta. Mi primer instinto
fue el de la libreta: una tarea tiene una asignatura, así que basta con
un campo de texto asignatura en cada tarea y agrupar por él en
pantalla. La interfaz habría sido idéntica. El modelo de debajo no la
habría respaldado: “Mates” y “Matemáticas” serían dos asignaturas
distintas, no habría dónde guardar la descripción de una asignatura o si
está archivada, y renombrarla obligaría a tocar todas sus tareas. Así que
SUBJECT pasó a ser su propia tabla, y cada tarea apunta a una.
Una tarea recurrente no es una tarea. El diseño tentador era una
única tabla TASK con un indicador is_recurring y una columna de
frecuencia. Pero las dos tienen ciclos de vida distintos. Una tarea la
crea el usuario, tiene una fecha límite opcional y termina cuando se
completa. Una tarea recurrente es una plantilla: no tiene fecha límite,
nunca se “completa”, solo se activa o desactiva, y las tareas reales las
genera el sistema a partir de ella. Una sola tabla para ambas habría
dejado la mitad de las columnas vacías según la fila, y cada consulta
tendría que recordar qué tipo estaba mirando. Así que son dos tablas,
unidas por una clave foránea opcional.
Una tercera decisión salió de pensar en el calendario. Quería cada día
coloreado según cuánto había completado, como el gráfico de
contribuciones de GitHub. Calcularlo al vuelo significa agregar todas las
tareas de cada día visible, cada vez que se carga el calendario. En su
lugar, una fila de PROGRESS_RECORD guarda lo que cada usuario completó
cada día, y el calendario solo tiene que leerla.
Con qué me quedo de esta etapa
- La mejor especificación de producto que tenía era una costumbre que llevaba años repitiendo. El boceto fue sobre todo una traducción de ella.
- Dibujar primero la interfaz me dijo qué tenía que soportar el modelo de datos. Y el modelo detectó cosas que el dibujo escondía, como que una asignatura tenía que existir por sí misma.
- Todas las apps que probé eran buenas. Ninguna era la mía. Ese hueco es un motivo perfectamente válido para construir algo.
El 2 de marzo de 2026 hice el primer commit. La siguiente parte trata del backend que salió de ahí, y de construirlo antes de que existiera una sola pantalla.
- Backend
- Frontend